
You will need to do the following: Have NetLogo installed. Give Java permission on your browser and accept the security warning to run the app.
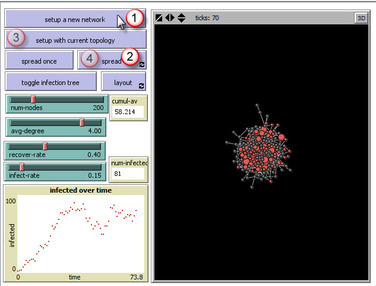
- Click Setup button
- Spread
- Setup topology: Just like real life, the original infected may of healed before it can infect others so try several times with
- Click Spread again to Stop it
powered by NetLogo
view/download model file: SIS.nlogo
WHAT IS IT?
Susceptible, Infection, Susceptible (SIS) epidemiology model.
Nodes recover and return to the ‘susceptible state’ after either a fixed time period, or with some probability at each time step.
The original documentation is placed in quotes.
"This model is a SI diffusion model on a random graph. SI means that individuals can be in two states - susceptible (meaning they can get the disease) or infected (meaning that they have the disease). Once they have the disease, they stay infected and can continue to infect others.
I’ve only really modified it to only optionally lay out the network, to have a probability ‘p’ of an infection spreading over an edge at each time step, and to plot the number of infected individuals over time.
Additionally, this is a diffusion model. After setting up the network with the desired number of nodes (num-nodes), it will infect one node at random. You can then step through the diffusion process either step by step (spread once) or until every node is infected (spread complete). The plot will show the number of nodes infected at each time point. The time monitor will give the current time, and in the case of the ‘spread complete’ option, how many steps it took until all the nodes are infected. Note that this is the SI model - nodes are either susceptible or infected and there is no recovery. The ‘p’ parameter gives the probability that a an infected node will infect a neighbor at each time step."
HOW IT WORKS
RECOVER-RATE: probability that infected goes back to susceptible
“The model creates a network of the ”numnodes" number of nodes with the given average degree, connecting pairs of nodes at random.
It then infects one individual at random.
The p slider determines the probability that an infected individual will infect a susceptible contact at every time step."
HOW TO USE IT
*Each node that is infected infects each of its uninfected neighbors with probability INFECT-RATE
*If a node is infected, after it is done with its infection attempts, with
probability RECOVER-RATE it goes back to susceptible.
"The LAYOUT? switch controls whether or not the layout procedure is run. This procedure attempts to move the nodes around to make the structure of the network easier to see.
The PLOT? switch turns off the plots which speeds up the model.
The RESIZE-NODES button will make all of the nodes take on a size representative of their degree distribution. If you press it again the nodes will return to equal size.
If you want the model to run faster, you can turn off the LAYOUT? and PLOT? switches and/or freeze the view (using the on/off button in the control strip over the view). The LAYOUT? switch has the greatest effect on the speed of the model.
If you have LAYOUT? switched off, and then want the network to have a more appealing layout, press the REDO-LAYOUT button which will run the layout-step procedure until you press the button again. You can press REDO-LAYOUT at any time even if you had LAYOUT? switched on and it will try to make the network easier to see."
Use the p slider to specify the probability that an infected individual will infect a susceptible contact at every time step.
View the progress of the disease diffusion on the network on the plot showing the cumulative number of individuals infected.
You can also specify the number of nodes and the average degree/node.
THINGS TO NOTICE
In this case you are looking for the conditions (e.g. given value of p or average degree) under which you will observe epidemics - outbreaks that affect a significant fraction of the network, vs. conditions under which the outbreak remains small and contained.
THINGS TO TRY
Set INFECT-RATE to 0.15, and RECOVER-RATE to 0.40. The NUM-NODES should be 200.
Repeatedly construct the network and reinfect it until you get an infection that is affecting a significant portion of the nodes. The way I like to do this is to construct the network once using SETUP-A-NEW-NETWORK, click on the SPREAD-REPEAT button, and then click on the SETUPWITH-CURRENT-TOPOLOGY button several times until the infection takes hold.
Let x be the average number of nodes infected in the long run (after a large initial infection) when AVG-DEGREE = 5. One approach is to keep a running average of the number of infected nodes, which you would reset after the infection establishes itself to avoid averaging the initial false starts (when the infection count is 0 because the infection has died out without achieving a steady state)
Let y be the same av. # nodes infected in the long run when AVG-DEGREE = 4 (remember to
click on SETUP-A-NEW-NETWORK when you change the average degree). Give the ratio x/y
(as a decimal). Your answer should be accurate to within 0.2. Please use only one decimal
place (to keep the grading program happy).
RELATED MODELS
Built on the Erdos Renyi Difussion model
http://www-personal.umich.edu/~ladamic/NetLogo/ERdiffusion.html
CREDITS AND REFERENCES
Homework assignment from awesome Social Networks Analysis course
https://www.coursera.org/course/sna
http://en.wikipedia.org/wiki/Compartmental_models_in_epidemiology#The_SIS_model
COPYRIGHT AND LICENSE
The original ER Diffusion model has this copyright
Copyright 2008 Uri Wilensky.
Modified by Lada Adamic 2009.

This work is licensed under the Creative Commons Attribution-NonCommercial-ShareAlike 3.0 License. To view a copy of this license, visit http://creativecommons.org/licenses/by-nc-sa/3.0/ or send a letter to Creative Commons, 559 Nathan Abbott Way, Stanford, California 94305, USA.
Commercial licenses are also available. To inquire about commercial licenses, please contact Uri Wilensky at uri@northwestern.edu.


 RSS Feed
